
grafana api---这个API令我发愁!
文章目录
序言
首先,明确目的:我想通过调用API来修改dashboard的报警阈值。因为grafana的报警(alerts)模块无法使用变量,而实际报警阈值应该随着数据的更新改变,这就有点落后了。
Create API tokens
- 通过基本任何(若打开),返回组织
curl http://admin:admin@localhost:3000/api/org  #将admin:admin是grafana登录的用户名,密码

#结果如下:
{"id":1,"name":"Main Org.","address":{"address1":"","address2":"","city":"","zipCode":"","state":"","country":""}}
- 创建一个名字为apitoken的token
curl -X POST -H "Content-Type: application/json" -d '{"name":"apitoken", "role": "Admin"}' http://admin:admin@localhost:3000/api/auth/keys

#结果如下
{"id":5,"name":"apitoken","key":"xyzabcoieDlVuiMxblY3Y2VoTEh2RTBkMXpiMDFvdGlOdXJmZUEiLctuIjoiabBpdabcdW4iLCJpZCI6MX0="}
#记得保存此token,用于认证
生成token后,登录grafana界面|Configuration|API keys,就可以看到(图二)。当然可以从grafana界面直接增加,但要记得设置合适有效期限(Expires)。用curl命令请求生成的token默认无过期日期。
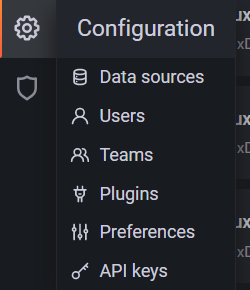
[外链图片转存失败,源站可能有防盗链机制,建议将图片保存下来直接上传(img-swt6NqZq-1664681092337)(C:\Users\paulwang\AppData\Roaming\Typora\typora-user-images\image-20220518140126020.png)]
Folder HTTP API
按照一定的标准把dashboard分类,放到不同的folder中。默认处于General中。
因此,可从folder开始找寻目标dashboard。
- 查看自定义的folder
url -X GET --insecure -H "Authorization: Bearer xyzbxxxieDlVuiMxblY3Y2VoTEh2RTBkMXpiMDFvdGlOdXJmZUEiLctuIjoiabBpdabcdW4iLCJpZCI6MX0=" -H "Content-Type: application/json" http://localhost:3000/api/folders
响应结果:
[
  {
    "id":1,                    #文件夹id
    "uid": "nErXDvCkzz",       #文件夹uid
    "title": "Department ABC"  #文件夹名字
  },
  {
    "id":2,
    "uid": "k3S1cklGk",
    "title": "Department RND"
  }
]
-
通过
folderIds获取某个文件夹下的所有dashboardfolderIds的id从上面的请求可以获取。
curl -X GET --insecure -H "Authorization: Bearer xyzbcjoieDlVuiMxblYxxxTEh2RTBkMXpiMDFvdGlOdXJmZUEiLctuIjoiabBpdabcdW4iLCJpZCI6MX0=" -H "Content-Type: application/json" http://localhost:3000/api/search?folderIds=59
响应格式:
[
	{
		"id": 58,                   # dashboard的id
		"uid": "tah4yssnk",         #dashboard的uid
		"title": "xxxxx(exx1min)",  #dashboard的名字
		"uri": "db/xxx-clxxront-every-1min",
		"url": "/d/tah4yssnk/krew-cxxront-every-1min",
		"slug": "",
		"type": "dash-db",
		"tags": [],
		"isStarred": false,
		"folderId": 59,             #文件夹id
		"folderUid": "VG6nqgU7z",
		"folderTitle": "xxxx",
		"folderUrl": "/dashboards/f/VG6nqgU7z/xxx",
		"sortMeta": 0
	},
	{
		"id": 55,
		"uid": "usOvuoynk",
		"title": "xxx(evxxx 1min)",
		"uri": "db/xxxxx-every-1min",
		"url": "/d/usOvuoynk/krxxxxb-evxxxry-1min",
		"slug": "",
		"type": "dash-db",
		"tags": [],
		"isStarred": false,
		"folderId": 59,
		"folderUid": "VG6nqgU7z",
		"folderTitle": "Krew",
		"folderUrl": "/dashboards/f/VG6nqgU7z/xxx",
		"sortMeta": 0
	},
	...
]
Dashboard HTTP API
Identifier (id) 和 unique identifier (uid)的区别
dashboard的id是一个自增的数字型的值。并且对于安装了一个grafana的情况,它是唯一的。
dashboard的uid可以唯一的区分不同的dashboard,即使安装了多个grafana。若创建dashboard时没有给出该值,则会自动生成。更改仪表板的标题不会破坏该仪表板的任何带有书签的链接。
综上,系统只有一个grafana服务,id和uid都可以唯一标识一个dashboard。
-
获取所有dashboard信息的基本信息
如id,uid,title。
curl -X GET --insecure -H "Authorization: Bearer xyzbcjoieDlVuiMxblY3Y2Voxxx2RTBkMXpiMDFvdGlOdXJmZUEiLctuIjoiabBpdabcdW4iLCJpZCI6MX0=" -H "Content-Type: application/json" http://localhost:3000/api/search
响应格式:
[
	{
		"id": 59,             #可唯一标识dashboard(系统只有一个grafana进程)
		"uid": "VG6nqgU7z",   #可唯一标识dashboard
		"title": "xxx",       #dashboard的名字
		"uri": "db/xxx",
		"url": "/dashboards/f/VG6nqgU7z/krew",
		"slug": "",
		"type": "dash-folder",
		"tags": [],
		"isStarred": false,
		"sortMeta": 0
	},
	{
		"id": 40,
		"uid": "L9GC4u-nk",
		"title": "yyy",
		"uri": "db/yyy",
		"url": "/dashboards/f/L9GC4u-nk/yyy",
		"slug": "",
		"type": "dash-folder",
		"tags": [],
		"isStarred": false,
		"sortMeta": 0
	},
    ...
]
- 通过dashboard的uid获取某个dashboard的所有信息
curl -X GET --insecure -H "Authorization: Bearer xyzbcjoieDlVuiMxblY3Y2VoTxxxTBkMXpiMDFvdGlOdXJmZUEiLctuIjoiabBpdabcdW4iLCJpZCI6MX0=" -H "Content-Type: application/json" http://localhost:3000/api/dashboards/uid/fbA1tgXnk
该响应包含dashboard的所有信息。
- 若上述dashuboard的id为59,则下面请求会获取dashboard的大致信息:
curl -X GET --insecure -H "Authorization: Bearer xyzbcjoieDlVuiMxblY3Y2VoTEh2RTxxxpiMDFvdGlOdXJmZUEiLctuIjoiabBpdabcdW4iLCJpZCI6MX0=" -H "Content-Type: application/json" http://localhost:3000/api/search?dashboardIds=59
响应格式:
{
		"id": 59,             #dashboard的id
		"uid": "VG6nqgU7z",   #dashboard的uid
		"title": "xxx",       #dashboard的标题
		"uri": "db/krew",
		"url": "/dashboards/f/VG6nqgU7z/xxx",
		"slug": "",
		"type": "dash-folder",
		"tags": [],
		"isStarred": false,
		"sortMeta": 0
}
- 更新一个dashboard
curl -X POST --insecure -H "Authorization: Bearer xyzbcjoieDlVuiMxblY3Y2VoTEh2RTBkMXpiMDFvdGlOdXJmZUEiLctuIjoiabBpdabcdW4iLCJpZCI6MX0=" -H "Content-Type: application/json" -d test.json http://localhost:3000/api/dashboards/uid/fbA1rgXnk
Alerting HTTP API
- 获取所有的报警
curl -X GET --insecure -H "Authorization: Bearer xyzbcjoieDlVuiMxblY3Y2VoTEh2RTBxxxiMDFvdGlOdXJmZUEiLctuIjoiabBpdabcdW4iLCJpZCI6MX0=" -H "Content-Type: application/json" http://localhost:3000/api/alerts/
#注意:最后的一个反斜杠若没有,可能请求获得其他结果。
响应:
[
  {
    "id": 1,
    "dashboardId": 1,  			 #可以唯一区分dashboard
    "dashboardUId": "ABcdEFghij" #可以唯一区分dashboard
    "dashboardSlug": "sensors",
    "panelId": 1,
    "name": "fire place sensor", #alert的名字
    "state": "alerting",
    "newStateDate": "2018-05-14T05:55:20+02:00",
    "evalDate": "0001-01-01T00:00:00Z",
    "evalData": null,
    "executionError": "",
    "url": "/d/rAZT-28nz/sensors"
  }
]
- 根据alert的id获取某个alert的信息
curl -X GET --insecure -H "Authorization: Bearer eyJrIjoiVTNPZTlpdUw1V1laakFYaTc5ZzBsOGk5OHFYaU5NNlYiLCJuIjoiYXBpa2V5Y3VybCIsImlkIjoxfQ==" -H "Content-Type: application/json" http://localhost:3000/api/alerts/7
响应:
{
	"Id": 10,
	"Version": 0,
	"OrgId": 1,
	"DashboardId": 60,
	"PanelId": 11,
	"Name": "xxx alert",    #alert的名字
	"Message": "",
	"Severity": "",
	"State": "ok",
	"Handler": 1,
	"Silenced": false,
	"ExecutionError": " ",
	"Frequency": 300,      #评估频率。即每300s评估一次
	"For": 1200000000000,  #单位s,设置alerting状态持续多久,才会发送通知。
	"EvalData": {},
	"NewStateDate": "2022-05-18T13:05:50+09:00",
	"StateChanges": 1,
	"Created": "2022-05-18T13:03:28+09:00",
	"Updated": "2022-05-18T13:03:28+09:00",
	"Settings": {
		"alertRuleTags": {},
		"conditions": [  #alert条件的设置
			{
				"evaluator": {
					"params": [   #这个域里面是要比较的值(阈值)
						0.4
					],
					"type": "gt"  #比较方式:大于0.4认为异常
				},
				"operator": {
					"type": "and"
				},
				"query": {        #alert所使用的请求的信息
					"datasourceId": 11,
					"model": {
						"alias": "[[tag_domain]]",
						"datasource": {
							"type": "influxdb",
							"uid": "wlFGuosnz"
						},
						"groupBy": [
							{
								"params": [
									"$__interval"
								],
								"type": "time"
							},
							{
								"params": [
									"domain"
								],
								"type": "tag"
							},
							{
								"params": [
									"null"
								],
								"type": "fill"
							}
						],
						"hide": false,
						"measurement": "xxxx", #这是请求使用的measurement的名字
						"orderByTime": "ASC",
						"policy": "default",
						"refId": "A",
						"resultFormat": "time_series",
						"select": [
							[
								{
									"params": [
										"count"
									],
									"type": "field"
								},
								{
									"params": [],
									"type": "last"
								}
							]
						],
						"tags": [
							{
								"key": "domain",
								"operator": "=",
								"value": "xxxxx"  #tag值
							}
						]
					},
					"params": [
						"A",
						"5m",
						"now"
					]
				},
				"reducer": {
					"params": [],
					"type": "last"
				},
				"type": "query"
			},
			{                 #这里是第二个报警条件
				"evaluator": {
					"params": [
						0.4
					],
					"type": "gt"
				},
				"operator": {
					"type": "or"  #多个报警条件使用“或”的关系
				},
				"query": {
					"datasourceId": 11,
					"model": {
						"alias": "[[tag_domain]]",
						"datasource": {
							"type": "influxdb",
							"uid": "wlFGuosnz"
						},
						"groupBy": [
							{
								"params": [
									"$__interval"
								],
								"type": "time"
							},
							{
								"params": [
									"domain"
								],
								"type": "tag"
							},
							{
								"params": [
									"null"
								],
								"type": "fill"
							}
						],
						"hide": false,
						"measurement": "xxxx",
						"orderByTime": "ASC",
						"policy": "default",
						"refId": "B",
						"resultFormat": "time_series",
						"select": [
							[
								{
									"params": [
										"count"
									],
									"type": "field"
								},
								{
									"params": [],
									"type": "last"
								}
							]
						],
						"tags": [
							{
								"key": "domain",
								"operator": "=",
								"value": "xxxx1"
							}
						]
					},
					"params": [
						"B",
						"5m",
						"now"
					]
				},
				"reducer": {
					"params": [],
					"type": "last"
				},
				"type": "query"
			},
			{                #第三个报警条件
				"evaluator": {
					"params": [
						0.4
					],
					"type": "gt"
				},
				"operator": {
					"type": "or"
				},
				"query": {
					"datasourceId": 11,
					"model": {
						"alias": "[[tag_domain]]",
						"datasource": {
							"type": "influxdb",
							"uid": "wlFGuosnz"
						},
						"groupBy": [
							{
								"params": [
									"$__interval"
								],
								"type": "time"
							},
							{
								"params": [
									"domain"
								],
								"type": "tag"
							},
							{
								"params": [
									"null"
								],
								"type": "fill"
							}
						],
						"hide": false,
						"measurement": "xxxxx",
						"orderByTime": "ASC",
						"policy": "default",
						"refId": "C",
						"resultFormat": "time_series",
						"select": [
							[
								{
									"params": [
										"count"
									],
									"type": "field"
								},
								{
									"params": [],
									"type": "last"
								}
							]
						],
						"tags": [
							{
								"key": "domain",
								"operator": "=",
								"value": "xxxxxxx"
							}
						]
					},
					"params": [
						"C",
						"5m",
						"now"
					]
				},
				"reducer": {
					"params": [],
					"type": "last"
				},
				"type": "query"
			}
		],
		"executionErrorState": "keep_state",
		"for": "20m",
		"frequency": "5m",
		"handler": 1,
		"name": "xxxxx alert",
		"noDataState": "keep_state",
		"notifications": [
			{
				"uid": "gPx-Ku_7k"
			},
			{
				"uid": "1uVPhvJnz"
			}
		]
	}
}
结语
折腾许久,发现要想实现通过API自动更新报警阈值,几乎就是要通过重新创建一个dashboard,倒是可以创建,但创建后的dashbord的报警阈值就再也改不了了(正常可以手动设置)。呜呼,我说不出话。
如有好的解决方法的小伙伴,还请不吝赐教!

加入社区!打开量化的大门,首批课程上线啦!
更多推荐

 2
2 0
0- 0


 已为社区贡献1条内容

所有评论(0)