
freqtrade基本的策略回测结果
·
简单策略回测
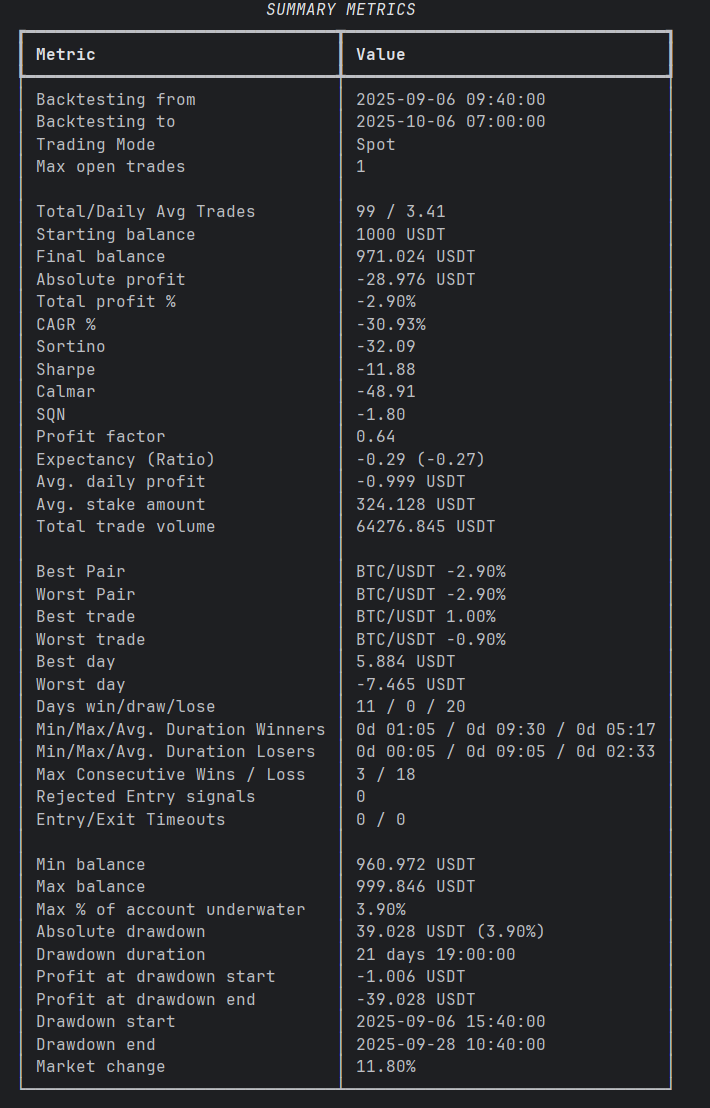
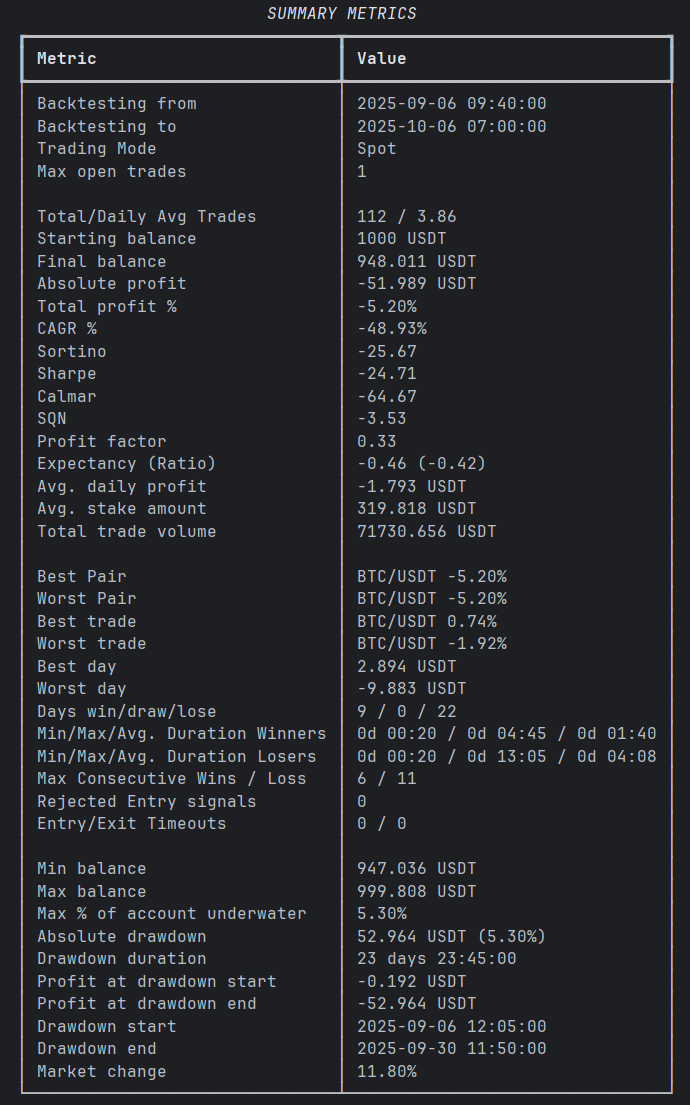
均线策略
原理:当短期移动平均线上穿长期移动平均线时买入,下穿时卖出。
def populate_indicators(self, dataframe: pd.DataFrame, metadata: dict) -> pd.DataFrame:
    dataframe['sma20'] = ta.SMA(dataframe, timeperiod=20)
    dataframe['sma50'] = ta.SMA(dataframe, timeperiod=50)
    return dataframe

def populate_entry_trend(self, dataframe: pd.DataFrame, metadata: dict) -> pd.DataFrame:
    dataframe.loc[
        (qtpylib.crossed_above(dataframe['sma20'], dataframe['sma50'])),
        'enter_long'] = 1
    return dataframe

def populate_exit_trend(self, dataframe: pd.DataFrame, metadata: dict) -> pd.DataFrame:
    dataframe.loc[
        (qtpylib.crossed_below(dataframe['sma20'], dataframe['sma50'])),
        'exit_long'] = 1
    return dataframe
回测结果如下:
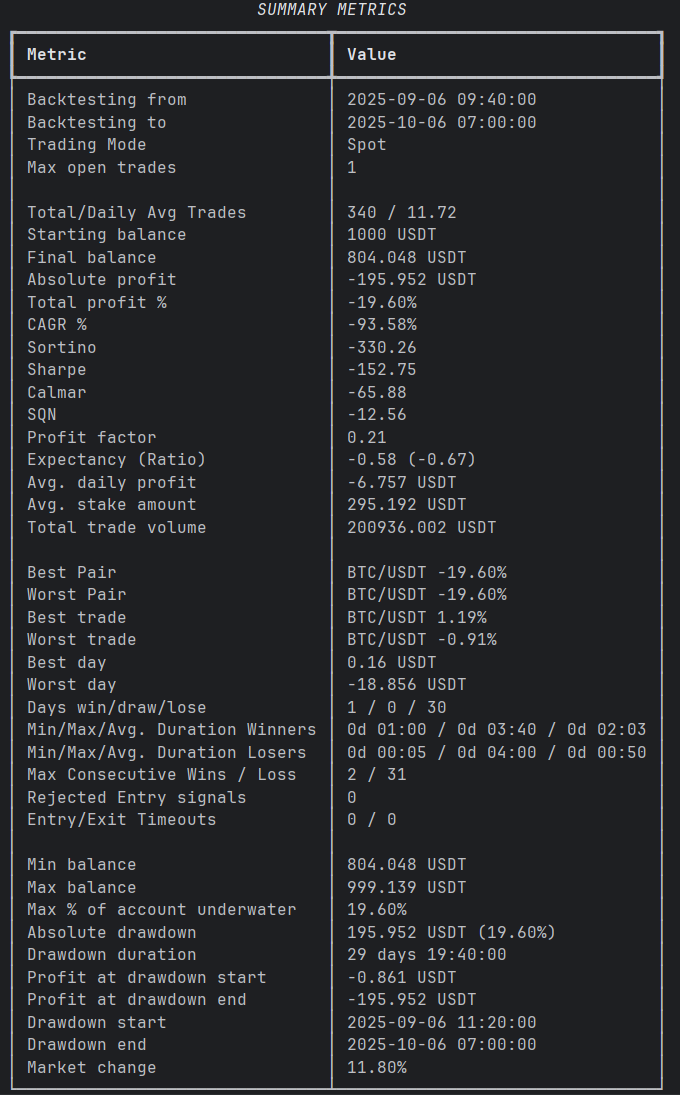
macd指标
   def populate_indicators(self, dataframe: DataFrame, metadata: dict) -> DataFrame:
        macd = ta.MACD(dataframe)
        dataframe['macd'] = macd['macd']
        dataframe['macdsignal'] = macd['macdsignal']
        dataframe['macdhist'] = macd['macdhist']

        return dataframe
    def populate_entry_trend(self, dataframe: DataFrame, metadata: dict) -> DataFrame:
        dataframe.loc[
            (qtpylib.crossed_above(dataframe['macd'], dataframe['macdsignal'])),
            'enter_long'] = 1

        return dataframe

    def populate_exit_trend(self, dataframe: DataFrame, metadata: dict) -> DataFrame:
        dataframe.loc[
            (qtpylib.crossed_below(dataframe['macd'], dataframe['macdsignal'])),
            'exit_long'] = 1

        return dataframe
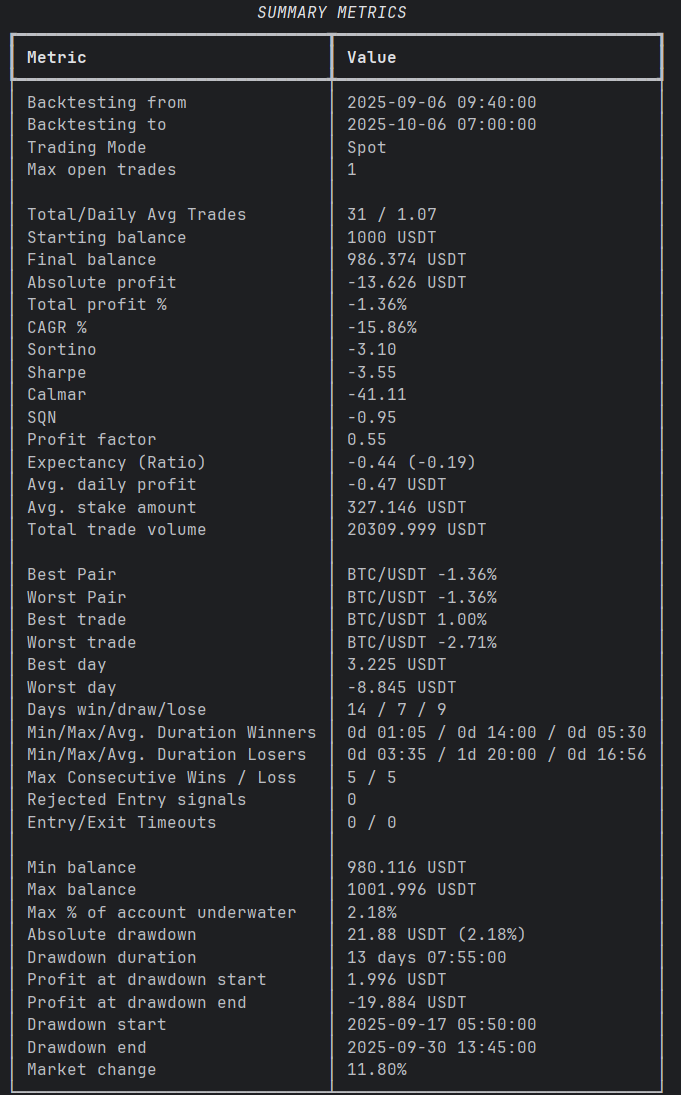
RSI指标
def populate_indicators(self, dataframe: pd.DataFrame, metadata: dict) -> pd.DataFrame:
    dataframe['rsi'] = ta.RSI(dataframe, timeperiod=14)
    return dataframe

def populate_entry_trend(self, dataframe: pd.DataFrame, metadata: dict) -> pd.DataFrame:
    dataframe.loc[
        (dataframe['rsi'] < 30),
        'enter_long'] = 1
    return dataframe

def populate_exit_trend(self, dataframe: pd.DataFrame, metadata: dict) -> pd.DataFrame:
    dataframe.loc[
        (dataframe['rsi'] > 70),
        'exit_long'] = 1
    return dataframe
结果如下:
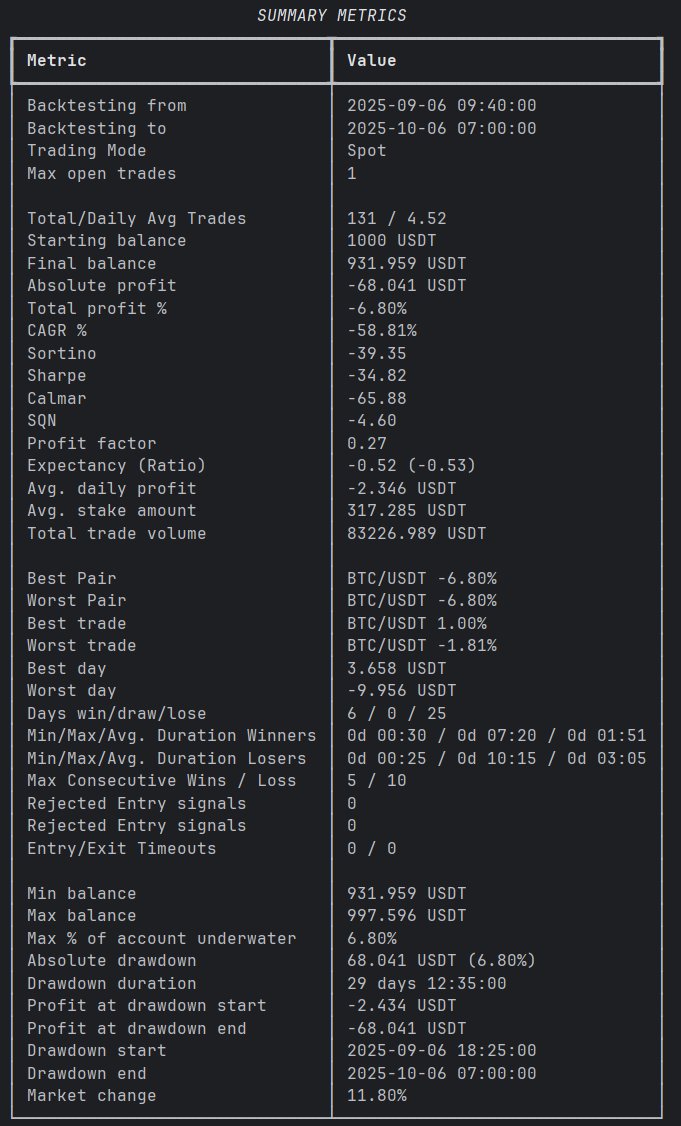
随机指标策略
    def populate_indicators(self, dataframe: DataFrame, metadata: dict) -> DataFrame:
        """
        Adds several different TA indicators to the given DataFrame

        Performance Note: For the best performance be frugal on the number of indicators
        you are using. Let uncomment only the indicator you are using in your strategies
        or your hyperopt configuration, otherwise you will waste your memory and CPU usage.
        :param dataframe: Dataframe with data from the exchange
        :param metadata: Additional information, like the currently traded pair
        :return: a Dataframe with all mandatory indicators for the strategies
        """
        stoch = ta.STOCH(dataframe)
        dataframe['slowk'] = stoch['slowk']  # %K 线
        dataframe['slowd'] = stoch['slowd']  # %D 线

        return dataframe

    def populate_entry_trend(self, dataframe: DataFrame, metadata: dict) -> DataFrame:
        """
        Based on TA indicators, populates the entry signal for the given dataframe
        :param dataframe: DataFrame
        :param metadata: Additional information, like the currently traded pair
        :return: DataFrame with entry columns populated
        """
        dataframe.loc[
            (
                # %K 线上穿 %D 线且在超卖区
                    (qtpylib.crossed_above(dataframe['slowk'], dataframe['slowd'])) &
                    (dataframe['slowk'] < 20) &
                    (dataframe['slowd'] < 20)
            ),
            'enter_long'] = 1

        return dataframe

    def populate_exit_trend(self, dataframe: DataFrame, metadata: dict) -> DataFrame:
        """
        Based on TA indicators, populates the exit signal for the given dataframe
        :param dataframe: DataFrame
        :param metadata: Additional information, like the currently traded pair
        :return: DataFrame with exit columns populated
        """
        dataframe.loc[
            (
                # %K 线下穿 %D 线且在超买区
                    (qtpylib.crossed_below(dataframe['slowk'], dataframe['slowd'])) &
                    (dataframe['slowk'] > 80) &
                    (dataframe['slowd'] > 80)
            ),
            'exit_long'] = 1
        return dataframe
回测结果
布林带指标
def populate_indicators(self, dataframe: pd.DataFrame, metadata: dict) -> pd.DataFrame:
    bollinger = qtpylib.bollinger_bands(qtpylib.typical_price(dataframe), window=20, stds=2)
    dataframe['bb_lowerband'] = bollinger['lower']
    dataframe['bb_middleband'] = bollinger['mid']
    dataframe['bb_upperband'] = bollinger['upper']
    return dataframe

def populate_entry_trend(self, dataframe: pd.DataFrame, metadata: dict) -> pd.DataFrame:
    dataframe.loc[
        (dataframe['close'] <= dataframe['bb_lowerband']),
        'enter_long'] = 1
    return dataframe

def populate_exit_trend(self, dataframe: pd.DataFrame, metadata: dict) -> pd.DataFrame:
    dataframe.loc[
        (dataframe['close'] >= dataframe['bb_upperband']),
        'exit_long'] = 1
    return dataframe
回测结果

加入社区!打开量化的大门,首批课程上线啦!
更多推荐

 1
1 0
0- 0


 已为社区贡献1条内容

所有评论(0)