
量化交易 - 概念板块+基本面选股【miniQmt+joinQuant】
哎,选股这块还是转战 joinQuant吧 (但是joinQuant的板块比较差,没有概念板块, 所以需要与qmt结合起来)这一步,可以根据个人喜好来筛选, 你可以根据上涨幅度、是否涨停等来筛选。可以发现, 价格是可以获取的, 但pe值全为0!但却下载不了数据, 一直等待中, 排查了半天。可以看我GitHub上对应项目。用qmt获取不到pe市盈率。我这里以基本面作为筛选., 一下子就正常使用了。
·
一、下载 保存板块到本地
from xtquant import xtdata

# 1. 下载最新板块分类信息(建议初始化时调用)
xtdata.download_sector_data()
# 2. 获取所有板块名称
sectors = xtdata.get_sector_list()
path = 'data/qmt_概念板块.txt'
save_to_local = True
if save_to_local:
    with open(path, 'w', encoding='utf-8') as f:
        f.write('\n'.join(sectors))
保存后如下图:
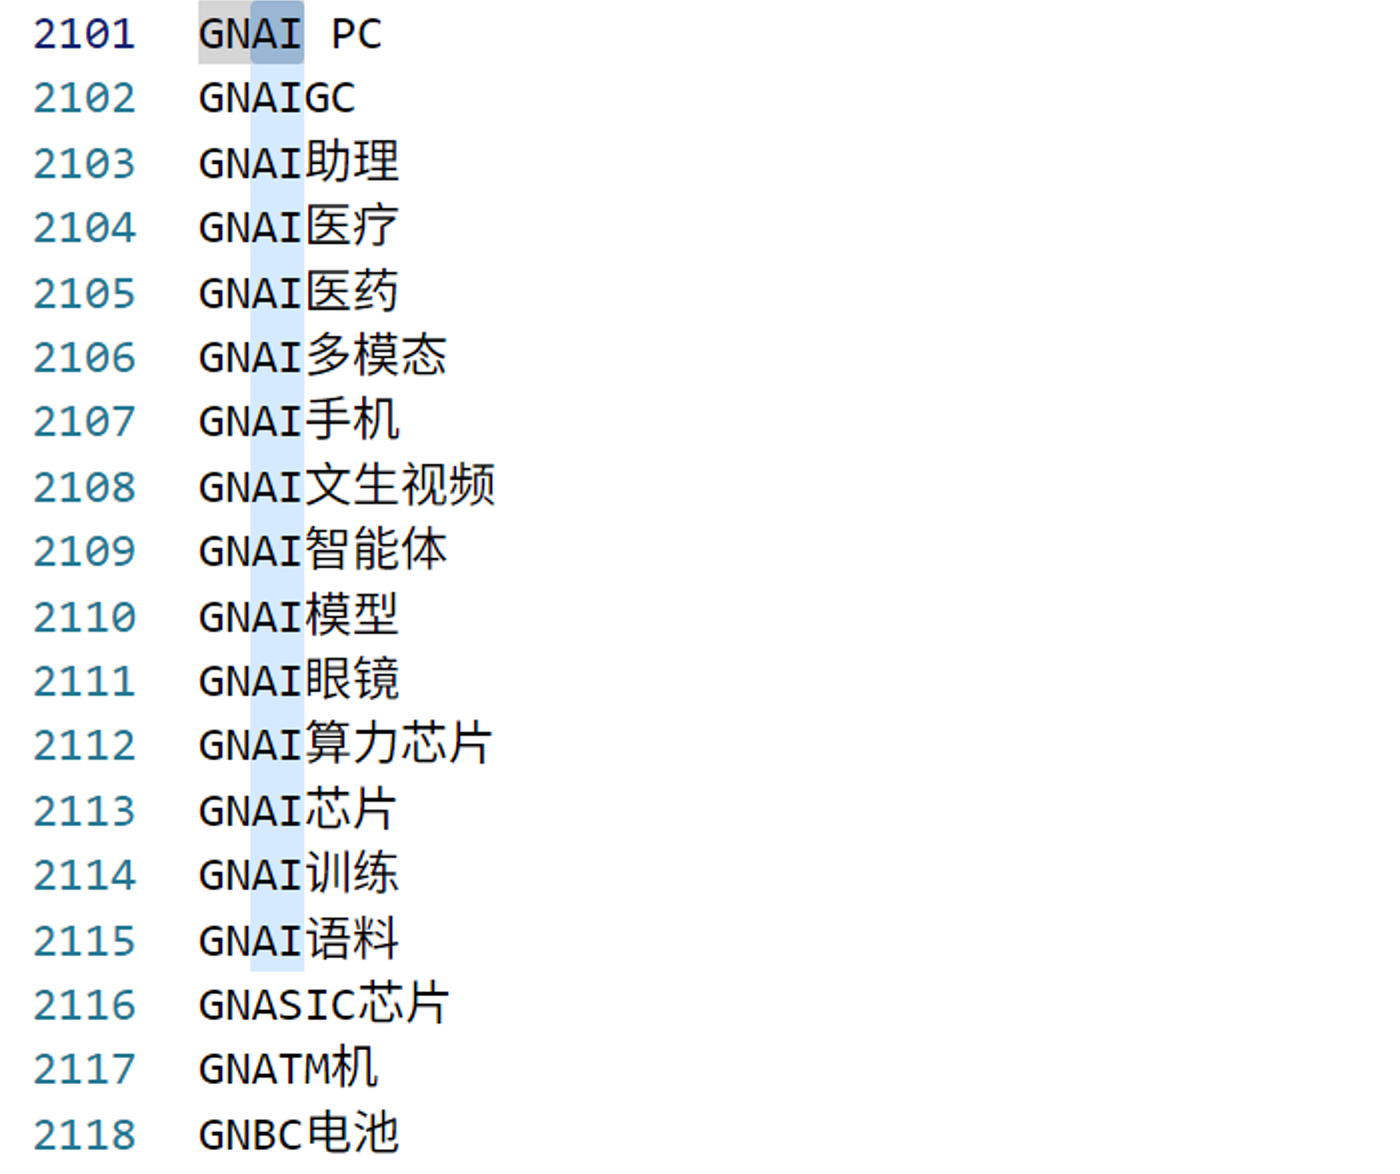
二、根据板块名称获取股票列表
from xtquant import xtdata

stocks = xtdata.get_stock_list_in_sector('GNAI算力芯片')
print(stocks)
结果如下:

三、下载财务数据【易踩坑】
官方:股票数据 | 迅投知识库
官方用的是这个函数:
xtdata.download_financial_data(["000001.SZ"], table_list=["Balance","Income"])
但却下载不了数据, 一直等待中, 排查了半天
后面换了一个函数xtdata.download_financial_data2, 一下子就正常使用了
from xtquant import xtdata

# 取数据前请确保已下载所需要的财务数据
xtdata.download_financial_data2(["000001.SZ"], table_list=["Balance","Income"])
print('finish download.')
x = xtdata.get_financial_data(["000001.SZ"],["Balance","Income"])
print(x)
结果如下:
finish download.
{'000001.SZ': {'Balance':     m_timetag m_anntime  internal_shoule_recv  ...  m_petainedProfit  m_provisionTransactionRisk  m_otherReserves
0    19911231  19920430                   NaN  ...               NaN                         NaN              NaN
1    19921231  19930226                   NaN  ...               NaN                         NaN              NaN
2    19931231  19940329                   NaN  ...               NaN                         NaN              NaN
3    19940630  19940630                   NaN  ...               NaN                         NaN              NaN
4    19941231  19950127                   NaN  ...               NaN                         NaN              NaN
..        ...       ...                   ...  ...               ...                         ...              ...
104  20230630  20230824                   NaN  ...               NaN                         NaN              NaN
105  20230930  20231025                   NaN  ...               NaN                         NaN              NaN
106  20231231  20240315                   NaN  ...               NaN                         NaN              NaN
107  20240331  20240420                   NaN  ...               NaN                         NaN              NaN
108  20250331  20250419                   NaN  ...               NaN                         NaN              NaN

[109 rows x 160 columns], 'Income':     m_timetag m_anntime   revenue_inc  earned_premium  ...  tot_compreh_inc_parent_comp  actual_ann_dt  operating_revenue  cost_of_goods_sold
0    19911231  19920430  3.346900e+08             0.0  ...                          0.0            0.0                0.0                 0.0
1    19921231  19930226  4.755108e+08             0.0  ...                          0.0            0.0                0.0                 0.0
2    19930630  19930805  2.664955e+08             0.0  ...                          0.0            0.0                0.0                 0.0
3    19931231  19940329           NaN             0.0  ...                          0.0            0.0                0.0                 0.0
4    19940630  19940630           NaN             0.0  ...                          0.0            0.0                0.0                 0.0
..        ...       ...           ...             ...  ...                          ...            ...                ...                 ...
144  20230630  20230824  8.861000e+10             NaN  ...                          0.0            0.0                0.0                 0.0
145  20230930  20231025  1.276340e+11             NaN  ...                          0.0            0.0                0.0                 0.0
146  20231231  20240315  1.646990e+11             NaN  ...                          0.0            0.0                0.0                 0.0
147  20240331  20240420  3.877000e+10             NaN  ...                          0.0            0.0                0.0                 0.0
148  20250331  20250419  3.370900e+10             NaN  ...                          0.0            0.0                0.0                 0.0

[149 rows x 84 columns]}}
其他数据, 如果你想下载,可以用这样:
from xtquant import xtdata
import pandas as pd

codes = ["000001.SZ", "600519.SH"]  # 替换成你的股票代码
for code in codes:
    xtdata.download_history_data(code, start_time='20250801',period='1d')
x = xtdata.get_market_data(["open", "close"], codes, count=3)
print(x)
结果如下:
{'open':            20250815  20250818  20250819
000001.SZ     12.23     12.06      12.1
600519.SH   1426.01   1426.99    1433.5, 'close':            20250815  20250818  20250819
000001.SZ     12.08     12.08     12.05
600519.SH   1422.08   1428.50   1439.60}
这里又有一个坑!
用qmt获取不到pe市盈率
代码如下:
from xtquant import xtdata
codes = ["000001.SZ", "600519.SH", "003010.SZ"]  # 替换成你的股票代码
for code in codes:
    # xtdata.download_history_data(code, start_time='20250801',period='1d')
    xtdata.download_history_data(code, start_time='20250818',period='tick')
x = xtdata.get_market_data_ex(['lastPrice', 'pe'], codes, period='tick', count=3)
print(x)
结果如下:
{'000001.SZ':                 lastPrice   pe
20250819112954      12.04  0.0
20250819112957      12.05  0.0
20250819113000      12.05  0.0, '003010.SZ':                 lastPrice   pe
20250819112954      53.70  0.0
20250819112957      53.71  0.0
20250819113000      53.71  0.0, '600519.SH':                 lastPrice   pe
20250819112954    1439.66  0.0
20250819112958    1439.66  0.0
20250819113000    1439.60  0.0}
可以发现, 价格是可以获取的, 但pe值全为0!
哎,选股这块还是转战 joinQuant吧 (但是joinQuant的板块比较差,没有概念板块, 所以需要与qmt结合起来)
四、根据基本面来筛选股票
这一步,可以根据个人喜好来筛选, 你可以根据上涨幅度、是否涨停等来筛选
我这里以基本面作为筛选.
筛选标准
最近5年roe均大于当年的平均水平, 最近一年roe排名前30%, 按照板块+roe降序排序
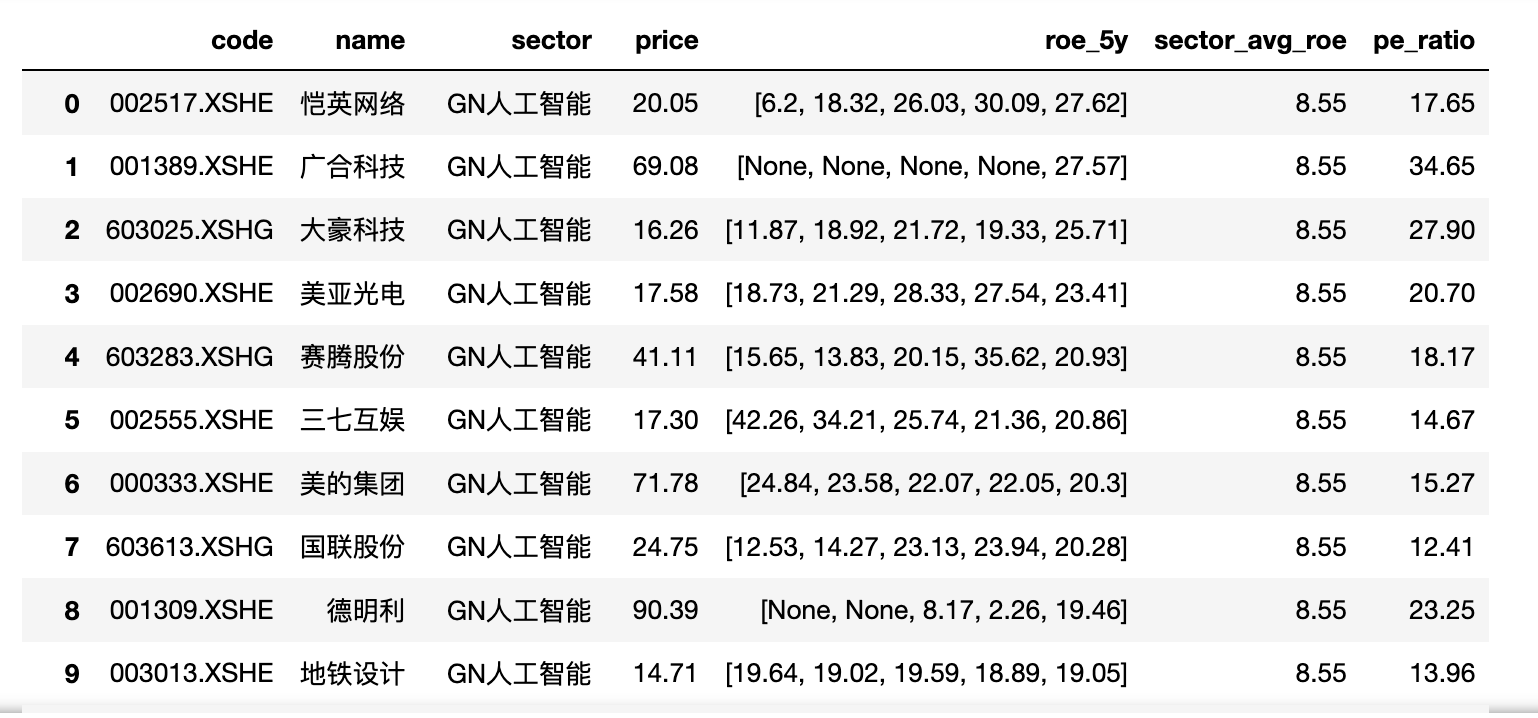
输出: 股票代码,股票名,板块名, 股价, 最近5年的roe, 板块平均roe, 市盈率
代码:
# qmt_概念板块.json  可以在https://github.com/JizhiXiang/Quant-Strategy 对应的QQ群里下载资源

# ====== 第1部分:读取数据与筛板块 ======
import json, pandas as pd
from jqdata import *
from datetime import datetime

with open('qmt_概念板块.json', 'r', encoding='utf-8') as f:
    sectors = json.load(f)

keyword = "人工智能"  #人形机器人
result = {k: v for k, v in sectors.items() if keyword in k}

print("【找到的板块】:", list(result.keys()))
print("【去重后的股票总数】:", len({c for v in result.values() for c in v}))

def to_jq_code(c):
    return c.replace('.SH','.XSHG').replace('.SZ','.XSHE')

stocks = sorted({
    to_jq_code(c) for v in result.values() for c in v
    if c.startswith(('60','00'))
})

# ====== 第2部分:获取最近5年财务数据并过滤 ======
y0 = datetime.today().year
years = list(range(y0-5, y0))  # y0-5 到 y0-1

q = query(valuation.code, valuation.pe_ratio, indicator.roe).filter(valuation.code.in_(stocks))
df = pd.concat([get_fundamentals(q, statDate=y).assign(year=y) for y in years], ignore_index=True)

# 当年样本平均ROE,并标记是否大于平均
df['roe_avg_year'] = df.groupby('year')['roe'].transform('mean')
df['gt_avg'] = df['roe'] > df['roe_avg_year']

# 条件:最近5年ROE均大于当年平均
flag_5y = df.groupby('code')['gt_avg'].all()
df = df[df.code.isin(flag_5y[flag_5y].index)].copy()

# 最近一年(用于排名与板块均值)
last = df[df.year == y0-1].copy()

# ====== 第3部分:多对多映射并“拆行” ======
rel_rows = []
for sec_name, codes in result.items():
    for c in codes:
        if c.startswith(('60','00')):
            rel_rows.append((to_jq_code(c), sec_name))
rel = pd.DataFrame(rel_rows, columns=['code', 'sector']).drop_duplicates()

# 将 last 拆成每行一个板块
last_exploded = last.merge(rel, on='code', how='inner')

# 板块平均ROE/PE(最近一年),兼容旧版 pandas 的写法
sector_summary = (last_exploded.groupby('sector')
                  .agg({'pe_ratio':'mean','roe':'mean','code':pd.Series.nunique})
                  .reset_index()
                  .rename(columns={'pe_ratio':'avg_pe','roe':'avg_roe','code':'n'}))

# 映射到明细
sector_avg_roe_map = dict(zip(sector_summary['sector'], sector_summary['avg_roe']))
sector_avg_pe_map  = dict(zip(sector_summary['sector'], sector_summary['avg_pe']))
last_exploded['sector_avg_roe'] = last_exploded['sector'].map(sector_avg_roe_map)
last_exploded['sector_avg_pe']  = last_exploded['sector'].map(sector_avg_pe_map)

# ====== 第4部分:取最近一年ROE前30%(按股票,不按板块行) ======
cut = last['roe'].quantile(0.7)
top_codes = set(last[last['roe'] >= cut]['code'])
res = last_exploded[last_exploded['code'].isin(top_codes)].copy()

# ====== 第5部分:补充“最近5年ROE列表”、名称与现价 ======
roe_hist = (df.pivot_table(index='code', columns='year', values='roe')
              .reindex(columns=years))
def _to_list(s):
    vals = []
    for x in s.values:
        if pd.isna(x):
            vals.append(None)
        else:
            vals.append(round(float(x), 4))
    return vals
roe_hist_list = roe_hist.apply(_to_list, axis=1).to_dict()
res['roe_5y'] = res['code'].map(roe_hist_list)

names = get_all_securities(['stock']).display_name.to_dict()
res['name'] = res['code'].map(names)

res['price'] = res['code'].apply(
    lambda x: float(get_price(x, count=1, end_date=datetime.today()).close[0])
)

# ====== 第6部分:分部分输出 ======
# 6.1 板块层面汇总(平均估值、平均ROE、样本数)
sector_summary['avg_pe'] = sector_summary['avg_pe'].round(2)
sector_summary['avg_roe'] = sector_summary['avg_roe'].round(2)
sector_summary = sector_summary.sort_values(['avg_pe','sector']).reset_index(drop=True)

print("\n【板块汇总:平均估值(PE) / 平均ROE / 样本股票数】")
print(sector_summary)

# 6.2 明细结果
res = res.sort_values(['sector','roe'], ascending=[True, False]).reset_index(drop=True)

# 数值字段统一保留两位小数
res['price'] = res['price'].round(2)
res['sector_avg_roe'] = res['sector_avg_roe'].round(2)
res['pe_ratio'] = res['pe_ratio'].round(2)
# roe_5y 是列表,需要单独处理
res['roe_5y'] = res['roe_5y'].apply(lambda lst: [None if v is None else round(v,2) for v in lst])

final_cols = ['code','name','sector','price','roe_5y','sector_avg_roe','pe_ratio']
print("\n【最终结果(ROE前30%样本,按板块+最近一年ROE降序)】")

res[final_cols]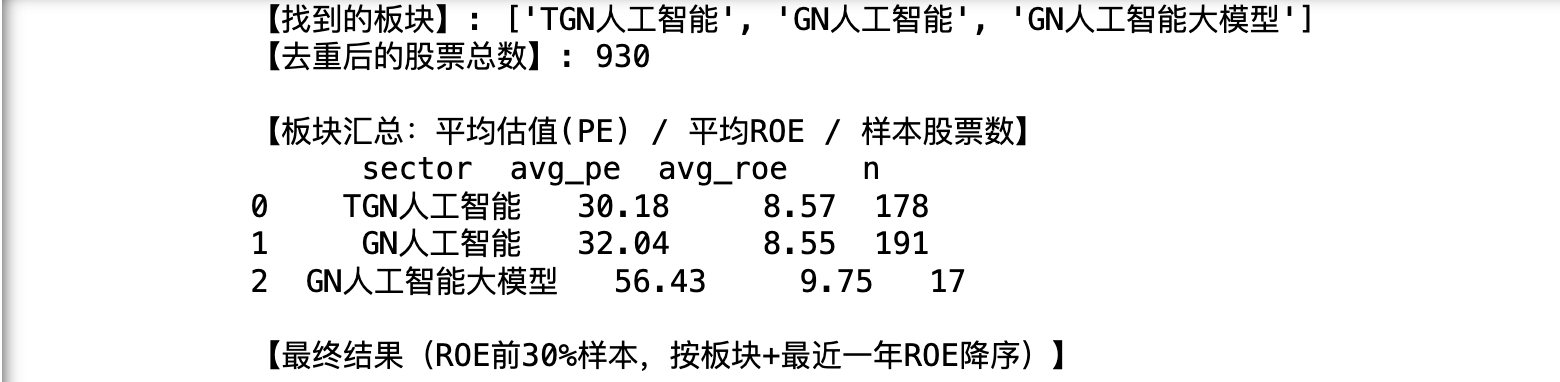
可以看我GitHub上对应项目
https://github.com/JizhiXiang/Quant-Strategy

加入社区!打开量化的大门,首批课程上线啦!
更多推荐

 8
8 0
0- 0


 已为社区贡献4条内容

所有评论(0)