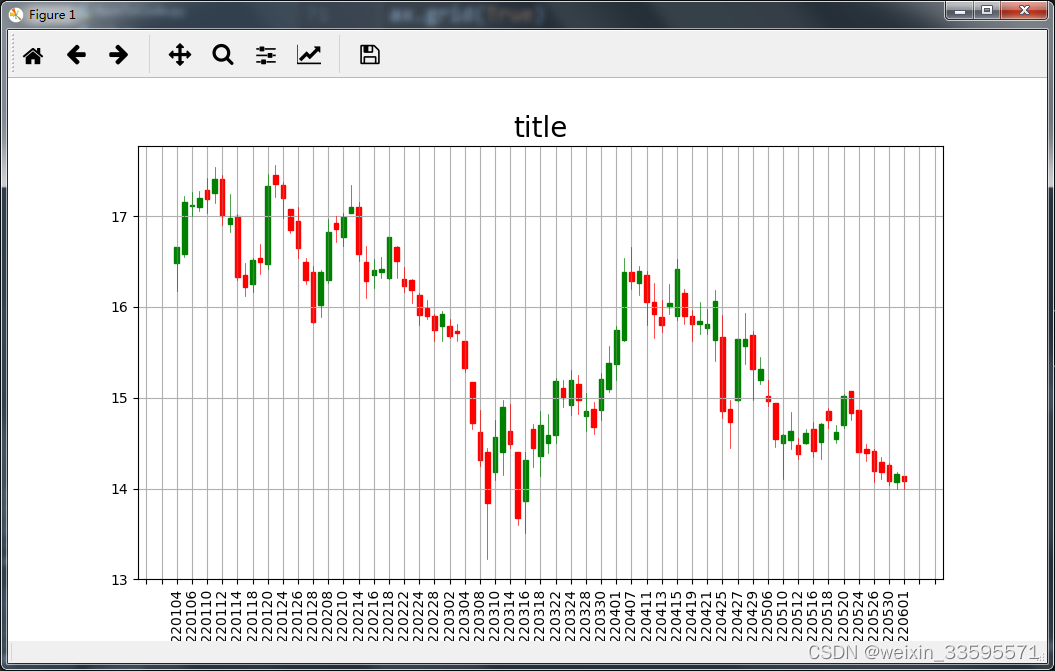
[023量化交易] python tushare下载数据 画出K线图
【代码】[023量化交易] python tushare下载数据 画出K线图。
·
from mplfinance.original_flavor import candlestick_ohlc
import matplotlib.pyplot as plt
import matplotlib.ticker as ticker
import tushare as ts

# 初始化pro接口
pro = ts.pro_api('')

# 拉取数据
data = pro.daily(**{
    "ts_code": "000001.SZ",
    "trade_date": "",
    "start_date": 20220101,
    "end_date": "20220601",
    "offset": "",
    "limit": ""
}, fields=[
    "trade_date",
    "open",
    "high",
    "low",
    "close",
    "vol",
    "pre_close"
])
print(data)
print(type(data))
# print(data.sort_index(ascending=False, inplace=True))
sort_df = data.sort_index(ascending=False)#  对DataFrame进行倒序
print(sort_df)
'''
   trade_date   open   high    low  close  pre_close         vol
0    20220601  14.14  14.14  14.00  14.08      14.16   845298.98
1    20220531  14.07  14.18  14.00  14.16      14.08   938868.55
2    20220530  14.26  14.28  14.04  14.08      14.18   896901.23
3    20220527  14.29  14.35  14.11  14.18      14.19   723066.74
4    20220526  14.41  14.43  14.07  14.19      14.39  1011317.56
'''
ohlc = []  # 存放行情数据,candlestick_ohlc需要传入固定格式的数据
row_number = 0
#  iterrows用于迭代(索引, 系列)对的行。   date为data第一个元素,row为data第二个元素后面的行
for date, row in sort_df.iterrows():
    date, openp, highp, lowp, closep = row[:5]
    ohlc.append([row_number, openp, highp, lowp, closep])
    row_number = row_number + 1

print("ohlc is:")
print(ohlc)

date_tickers = sort_df.trade_date.values  # 获取Date数据  时间列表


def format_date(x, pos=None):
    # 由于前面股票数据在 date 这个位置传入的都是int
    # 因此 x=0,1,2,...
    # date_tickers 是所有日期的字符串形式列表
    if x < 0 or x > len(date_tickers) - 1:
        return ''
    return date_tickers[int(x)]


fig = plt.figure(figsize=(12, 8))  # 设置长,宽
ax = fig.add_subplot(111)  # 111 大小 111坐标系
# ax坐标系,开盘  收盘 最高  最低  k线宽度 k线红 绿
candlestick_ohlc(ax, ohlc, colorup="g", colordown="r", width=0.6)

#   matplotlib.ticker.FuncFormatter类使用用户定义的函数进行格式化
ax.xaxis.set_major_formatter(ticker.FuncFormatter(format_date))
plt.xticks(rotation=90)  #  日期旋转90度
ax.xaxis.set_major_locator(ticker.MultipleLocator(2))  # 设置间隔为6个交易日
ax.grid(True)
ax.set_title("title", fontsize=20)
# ax.legend() #  图上标明一个图例

plt.show()  # 显示图形

专业量化交易与投资者大本营
更多推荐


 0
0 0
0- 0


 已为社区贡献25条内容

所有评论(0)